We read the published research on why paper and live diverge, then checked it against 41 live sessions of our own. Most of what we saw agrees with the research. One standard measure misleads on quiet days.
What does the published research say?
Researchers measure two different gaps.
| Gap | The question | What studies find |
|---|---|---|
| Implementation gap | Same rules, same period. How far is the real portfolio from the paper one? | Perold [1] framed it as an implementation shortfall. Johansson et al. [3] find tradable factors trail on-paper factors by 2-4% a year; fees and transaction costs explain 58% of it and opportunity cost the rest (~35 to 40%). Frazzini et al. [4] find one large equity manager's live costs an order of magnitude below earlier estimates. Muravyev and Pearson [5] find US equity option executions can cost well under conventional estimates. |
| Edge-decay gap | New data. Does the backtested edge survive? | Wiecki et al. [6] studied 888 algorithms. Backtest Sharpe explained under 2.5% of out-of-sample Sharpe, and more backtesting meant a bigger gap. McLean and Pontiff [7] find predictor returns 26% lower out-of-sample and 58% lower after publication. Harvey and Liu [8] propose a non-linear haircut to backtested Sharpe ratios. |
Almgren and Chriss [2] set execution cost against the risk of waiting. That is the trade-off behind every order a live system sends.
Three limits stand out:
- Asset class. Most of this work covers equities and factor portfolios.
- Frequency. Results are annual or per trade. Order-level data is needed to split the implementation gap into delay, execution and missed orders.
- Benchmark. We found no published benchmark for how closely a strategy's live daily P&L tracks its backtest.
So we measured our own.
What did we test at MoNOR?
We tested a few strategies. Every strategy had a backtest of the same rules on the same days. We lined them up, day by day.
- Window. 41 trading sessions between August and October 2026.
- Scope. 14 strategies and 386 strategy-days with any activity.
- Basis. Live P&L comes from actual fill prices. Both series exclude brokerage, taxes and exchange fees.
- Scale. Each P&L is divided by that strategy's own typical day, so the charts carry no rupee values.
- Gap ratio. Absolute gap divided by absolute backtest P&L.
What does live look like against the backtest?
Figure 1 plots every strategy-day. A point on the dashed line is a perfect match.
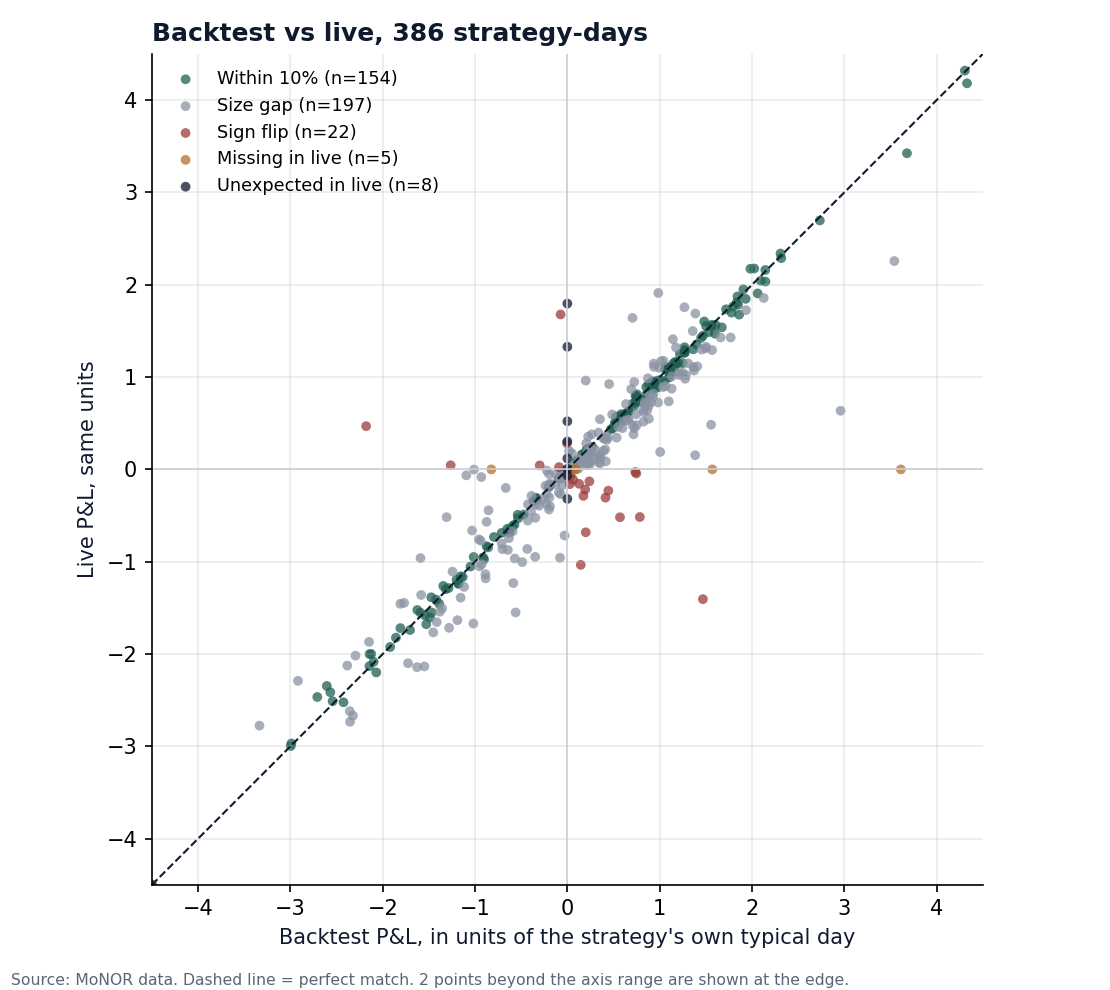
The scaled correlation is 0.95. Where both sides held a position, live captured 0.93 of backtest size on average. Live landed within 10% of backtest on 40% of strategy-days.
What kind of mismatch is it?
We sorted every strategy-day into five types.
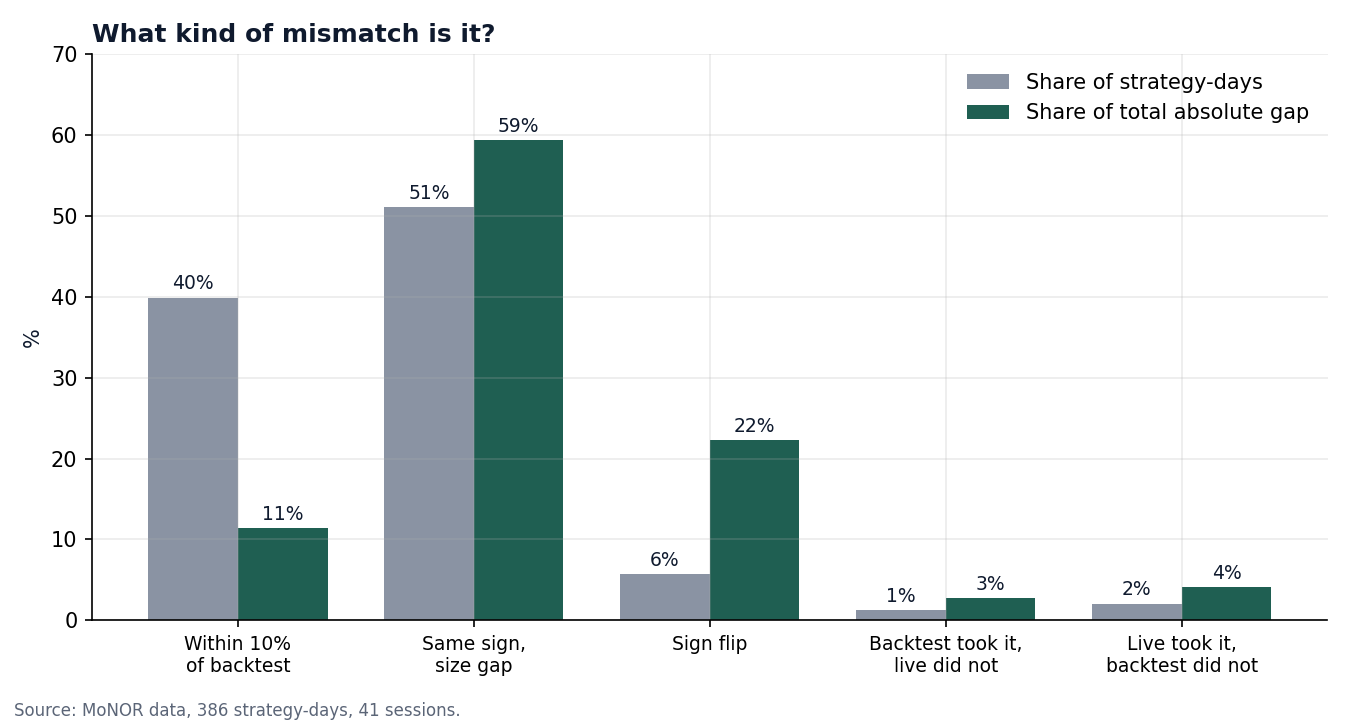
| Type | Strategy-days | Share of days | Share of gap |
|---|---|---|---|
| Within 10% of backtest | 154 | 40% | 11% |
| Same sign, size gap | 197 | 51% | 59% |
| Sign flip | 22 | 6% | 22% |
| Backtest took it, live did not | 5 | 1% | 3% |
| Live took it, backtest did not | 8 | 2% | 4% |
What the split shows:
- Size dominates. Same-sign size gaps are 51% of days and 59% of the gap.
- Sign flips are rare and costly. They are 6% of days and 22% of the gap. 12 of the 22 fell on days when backtest P&L was under a quarter of a typical day. A small price difference can flip the sign of a near-zero day.
- Missed and extra positions are small. Together 13 strategy-days and 7% of the gap.
- Live trails mostly on winning days. On 207 same-sign winning days, live P&L was 5.6% of backtest P&L lower. On 144 same-sign losing days the shortfall was 0.6%.
- The tail is moderate. The ten largest strategy-days hold 23% of the gap. The largest forty hold 49%.
Can a daily percentage gap mislead?
Yes. The usual daily percentage gap divides by that day's backtest P&L. On a quiet day that number is close to zero.
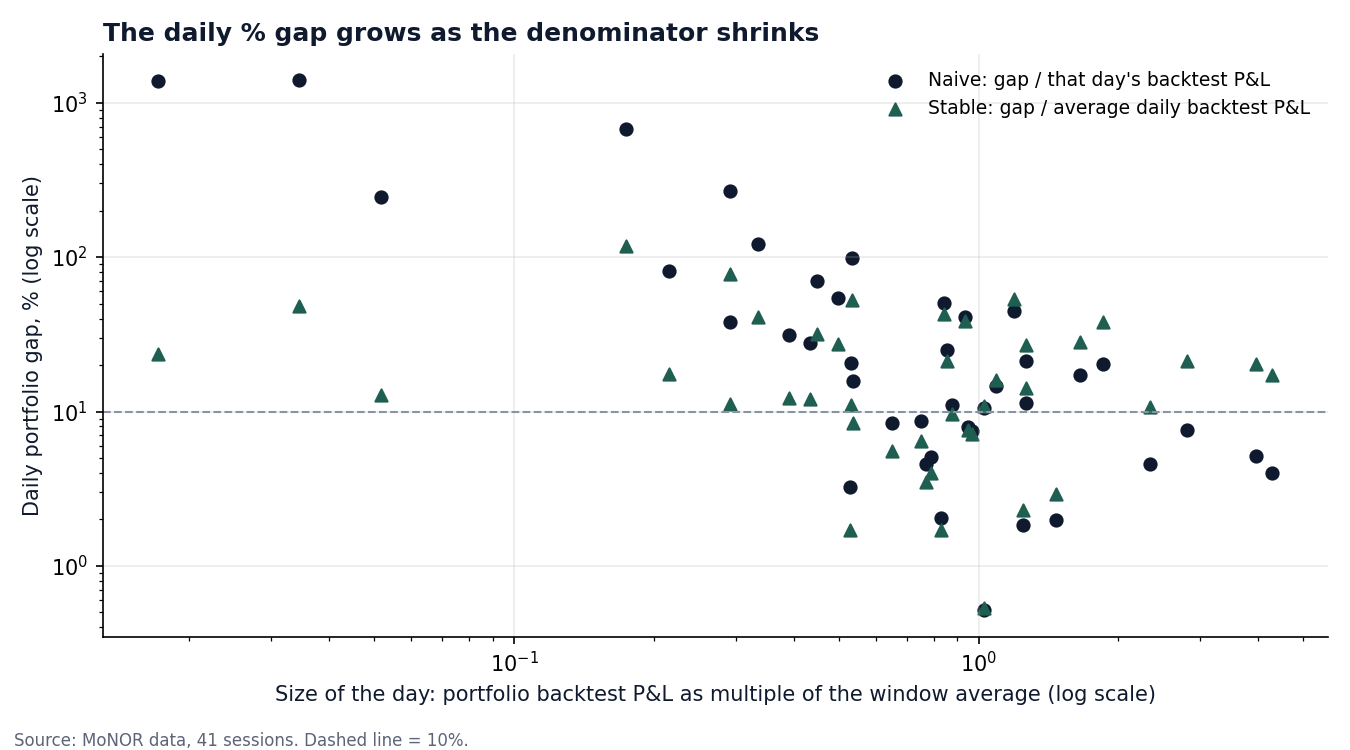
| Measure | Median | Maximum |
|---|---|---|
| Naive: gap / that day's backtest P&L | 17.1% | 1,391% |
| Stable: gap / average daily backtest P&L | 14.3% | 117% |
On one quiet day the naive gap read 1,391%. The stable measure read 117% for the same session. The naive measure exceeded 50% on 11 days, and 10 of them were below-median days. By strategy-day the median relative gap falls from 57% on days under 0.25 of a typical day to 6.3% above 1.5.
What happens when strategies are combined?
Gaps partly cancel. Pooled across strategies the gap ratio is 21%. At portfolio level it is 11%.
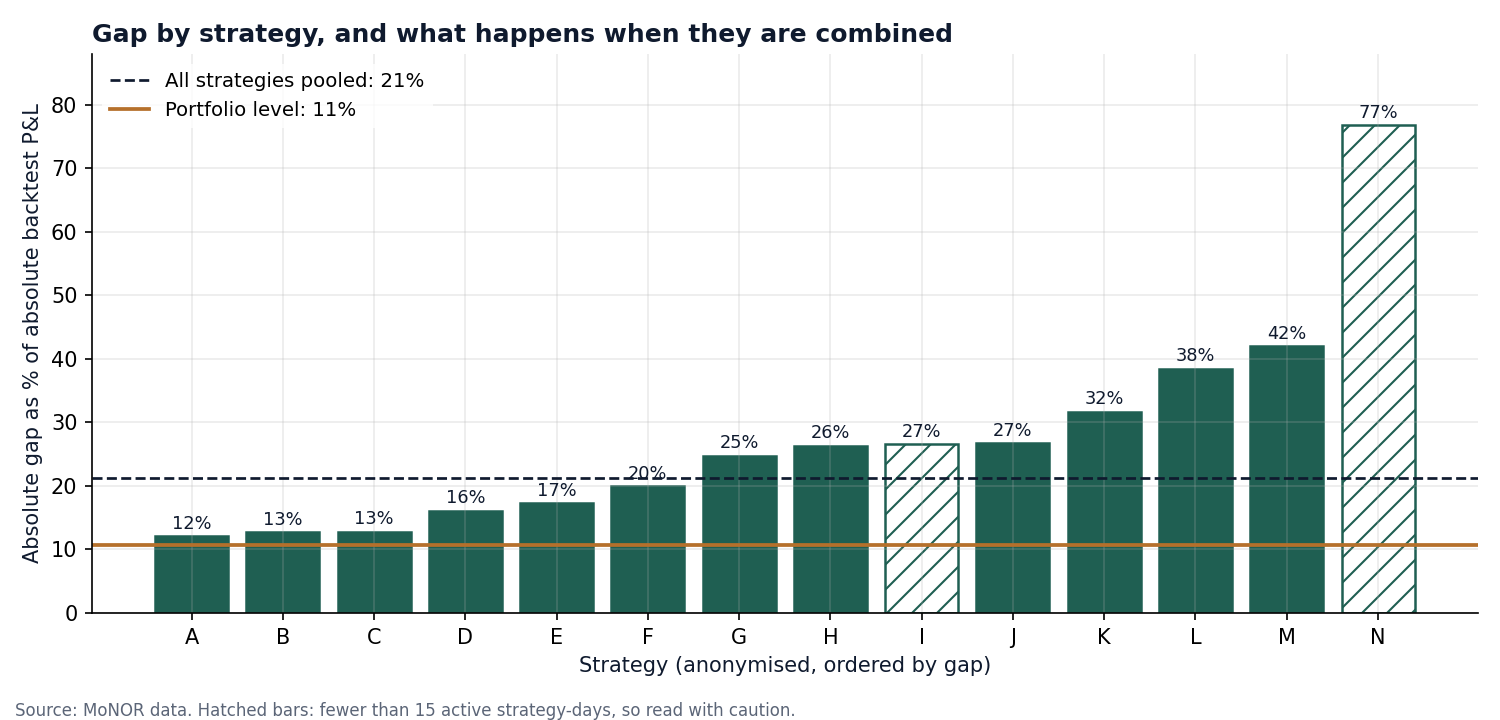
Strategy-level gaps run from 12% to 77%. The five lowest sit at 12% to 17%, each with a correlation of at least 0.97. Strategies I, N have fewer than 15 active days, so read their bars with caution. On 56% of portfolio days, live P&L was within 10% of backtest or better.
Does our live data agree with the research?
| What the research says | What we see | Fit |
|---|---|---|
| Live trails paper [1][3] | On same-sign days, live P&L is 3.4% of backtest P&L lower | Direction agrees. Units differ. |
| The gap is more than cost: opportunity cost matters [3] | Size gaps are 59% of the gap. Timing-like items (sign flips, missed and extra positions) are 29% | Resembles it. The mapping is ours. |
| Execution costs can be lower than conventional estimates [4][5] | Live was above backtest on 27% of winning days and 47% of losing days | Consistent. The gap is two-sided. |
| Costs rise with volatility [4] | The absolute gap rises from 0.17 to 0.32 typical-day units as days get larger | Consistent. We have not tested volatility directly. |
| Backtests overstate new-sample performance [6][7][8] | Not tested. Our comparison uses the same days | Not comparable. |
How often live lands above backtest depends on the fill prices the backtest assumes. Our series exclude explicit charges that the published figures include, so the match is directional only.
What did we learn?
- Match rate and gap ratio tell different stories. Only 40% of strategy-days land within 10%, yet the portfolio gap is 11%.
- The denominator matters as much as the data. The same session read 1,391% or 117% depending on the measure.
- Combining strategies absorbs gaps. Portfolio level is about half the strategy-level figure.
What can you check in your own data?
- Sort before averaging. Split each strategy-day into the five types above. Size, sign and missed positions need different fixes.
- Use a stable denominator. Divide the gap by average daily absolute backtest P&L.
- Report at two levels. Compare strategy-level and portfolio-level gaps.
What can this data not tell us?
- Cause. Daily P&L cannot separate delay, execution cost and price-source differences. That needs fill-level data, which is our next step.
- Sample. 41 sessions is one window, and some strategies have only a handful of active days.
- Direction. The lower live P&L, mostly on winning days, is an observation. We have not tested a cause.
References
[1] Perold, A. F. (1988). The implementation shortfall: Paper versus reality. Journal of Portfolio Management, 14(3), 4-9.
[2] Almgren, R., & Chriss, N. (2000). Optimal execution of portfolio transactions. Journal of Risk, 3(2), 5-39.
[3] Johansson, A., Sabbatucci, R., & Tamoni, A. (2025). Tradable risk factors for institutional and retail investors. Review of Finance, 29(1), 103-139.
[4] Frazzini, A., Israel, R., & Moskowitz, T. J. (2018). Trading costs. SSRN working paper 3229719.
[5] Muravyev, D., & Pearson, N. D. (2020). Options trading costs are lower than you think. Review of Financial Studies, 33(11), 4973-5014.
[6] Wiecki, T., Campbell, A., Lent, J., & Stauth, J. (2016). All that glitters is not gold: Comparing backtest and out-of-sample performance on a large cohort of trading algorithms. Quantopian working paper.
[7] McLean, R. D., & Pontiff, J. (2016). Does academic research destroy stock return predictability? Journal of Finance, 71(1), 5-32.
[8] Harvey, C. R., & Liu, Y. (2015). Backtesting. Journal of Portfolio Management, Fall 2015.
Methodology note
Source. Live MoNOR daily data. Both backtest and live series are gross of explicit charges (brokerage, taxes and exchange fees). Every daily total reconciles to the source record. No rupee values, strategy names or thresholds appear in this article.
Scale. Each P&L is divided by the strategy's mean absolute backtest P&L over its active days.
Types. Within 10%: live is within 10% of backtest P&L. Size gap: same sign, outside 10%. Sign flip: both non-zero, opposite signs. Backtest took it, live did not: live is zero. Live took it, backtest did not: backtest is zero.
Measures. Gap ratio: sum of absolute gaps divided by sum of absolute backtest P&L. Portfolio gap ratio: the same measure on daily portfolio totals. Capture: slope of live on backtest through the origin, where both are non-zero. Direction: sum of live minus backtest, divided by sum of absolute backtest P&L, over same-sign strategy-days. Naive gap: absolute portfolio gap divided by that day's absolute backtest P&L. Stable gap: the same gap divided by the window's average daily absolute backtest P&L.
Literature. Citations were checked against publisher or repository records. Figures quoted from published studies are as reported by their authors.
This article is research communication. It is not an offer, solicitation or advice, and it makes no market call.